Latest Environmental Content Libya flood disaster
2023/09/16
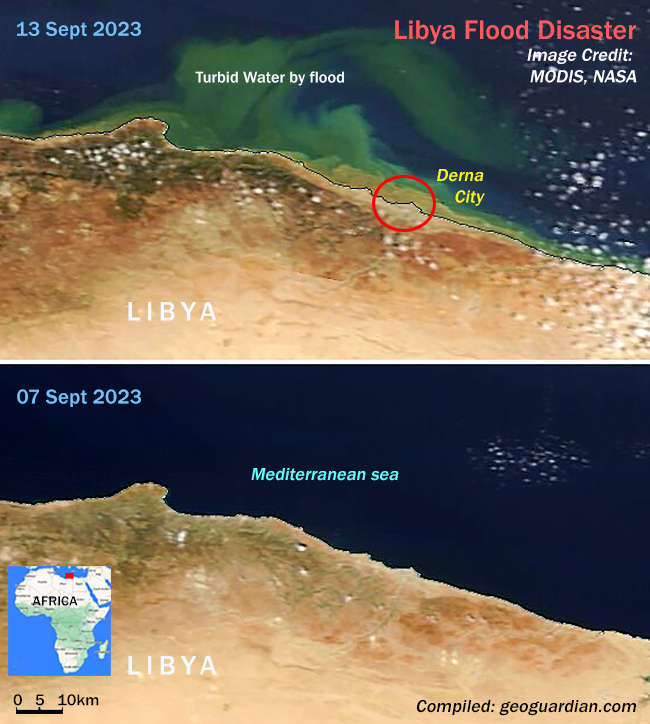
Storm Daniel, became the deadliest and costliest Mediterranean tropical-like cyclone ever recorded since Cyclone Nargis in 2008. In Derna, a northern coastal city of Libya, at least 10,000 people were confirmed dead after the Derna and Mansour dams collapsed, releasing millions of cubic metres of water and destroying a large part of Derna city. Images show a calm Mediterranean Sea on Sept 7th and the same region on Sept 13th after the storm hit. The turbidity in seawater by the flood is visible in the Sept 13th image. Check SeeSatView app for an image of Storm Daniel.
Lake Sylvester a lake again...!
2023/03/16
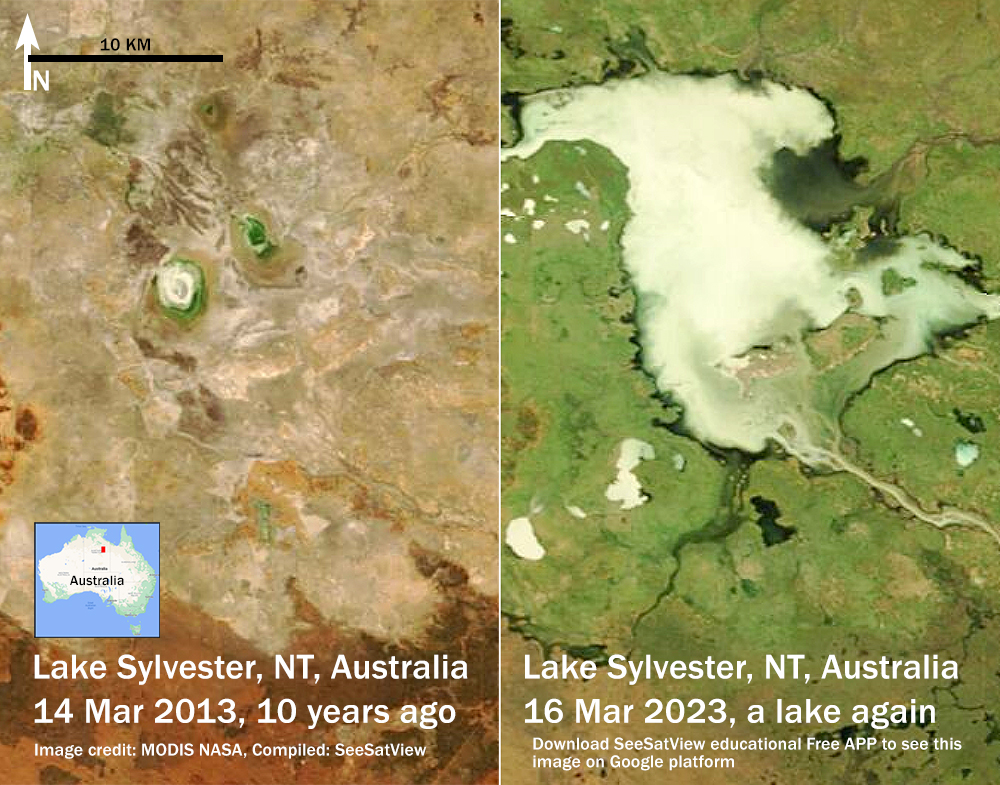
Lake Sylvester in Nothern Territory, Australia, was almost dry due to prolonged below-average rainfall in recent years. However, the region is green, and the lake has formed again after heavy rain in the last few months. Download and see these images in SeeSatView App (Educational and Free), which runs by Geoguardian.com. In SeeSatView, you can check surrounding information using the Google mapping platform.
M 7.6 Earthquake hits Indonesia
2023/01/10
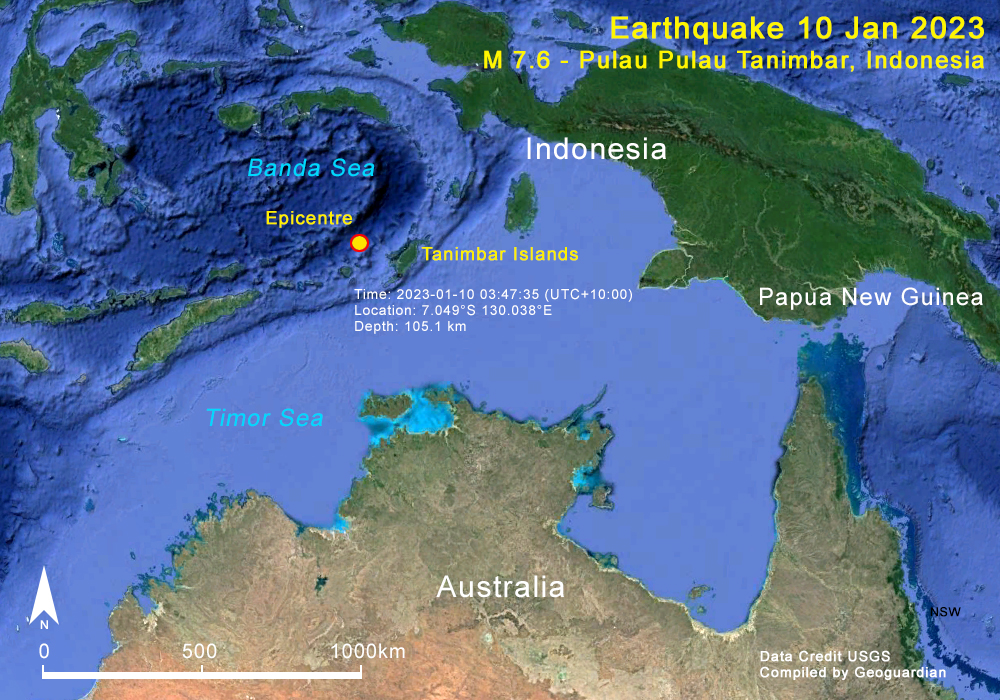
A powerful M 7.6 earthquake has struck near Tanimbar Islands in Indonesia, about 500km north to Darvin, Australia. Tremors felt in Darwin in the Northern Territory, Australia, and other surrounding islands. There was no warning for tsunami, from the earthquake, which was recorded 105km below the Banda Sea. If an earthquake of this magnitude hits closer to the ocean bed, a massive risk of tsunami can be expected.
Snow in NSW, Australia
2021/06/10
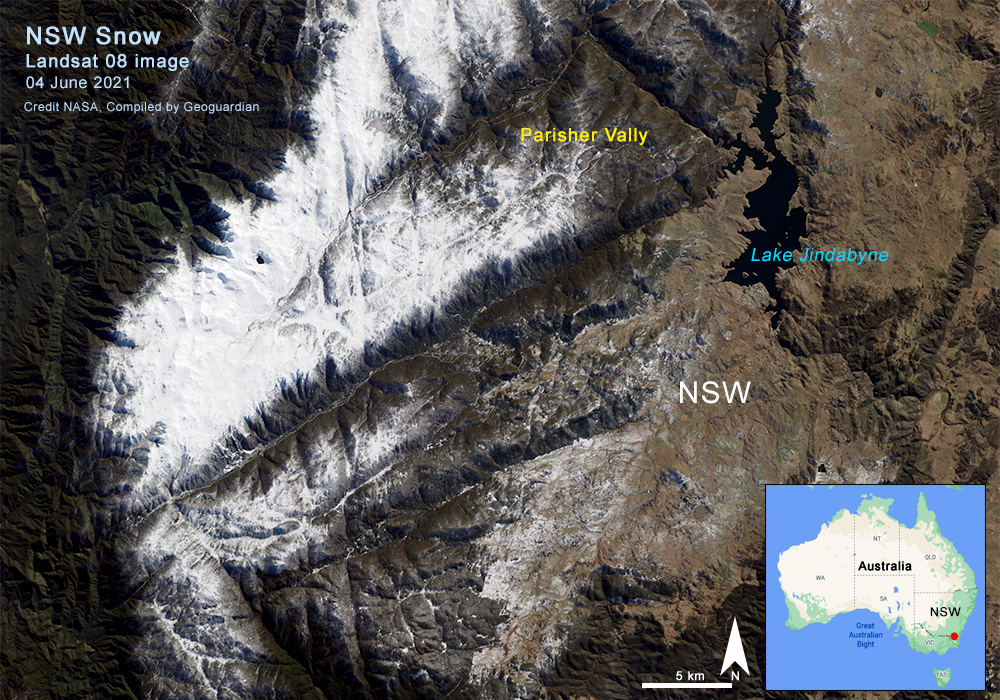
This satellite image of the snow in New South Wales was captured on June 4, 2015, by the Operational Land Imager (OLI) on Landsat 8 (image credit: NASA). During this cold snap, metropolitan Sydney reached a maximum of 10.3 degrees on June 10, making it the coldest day overall since 1984.
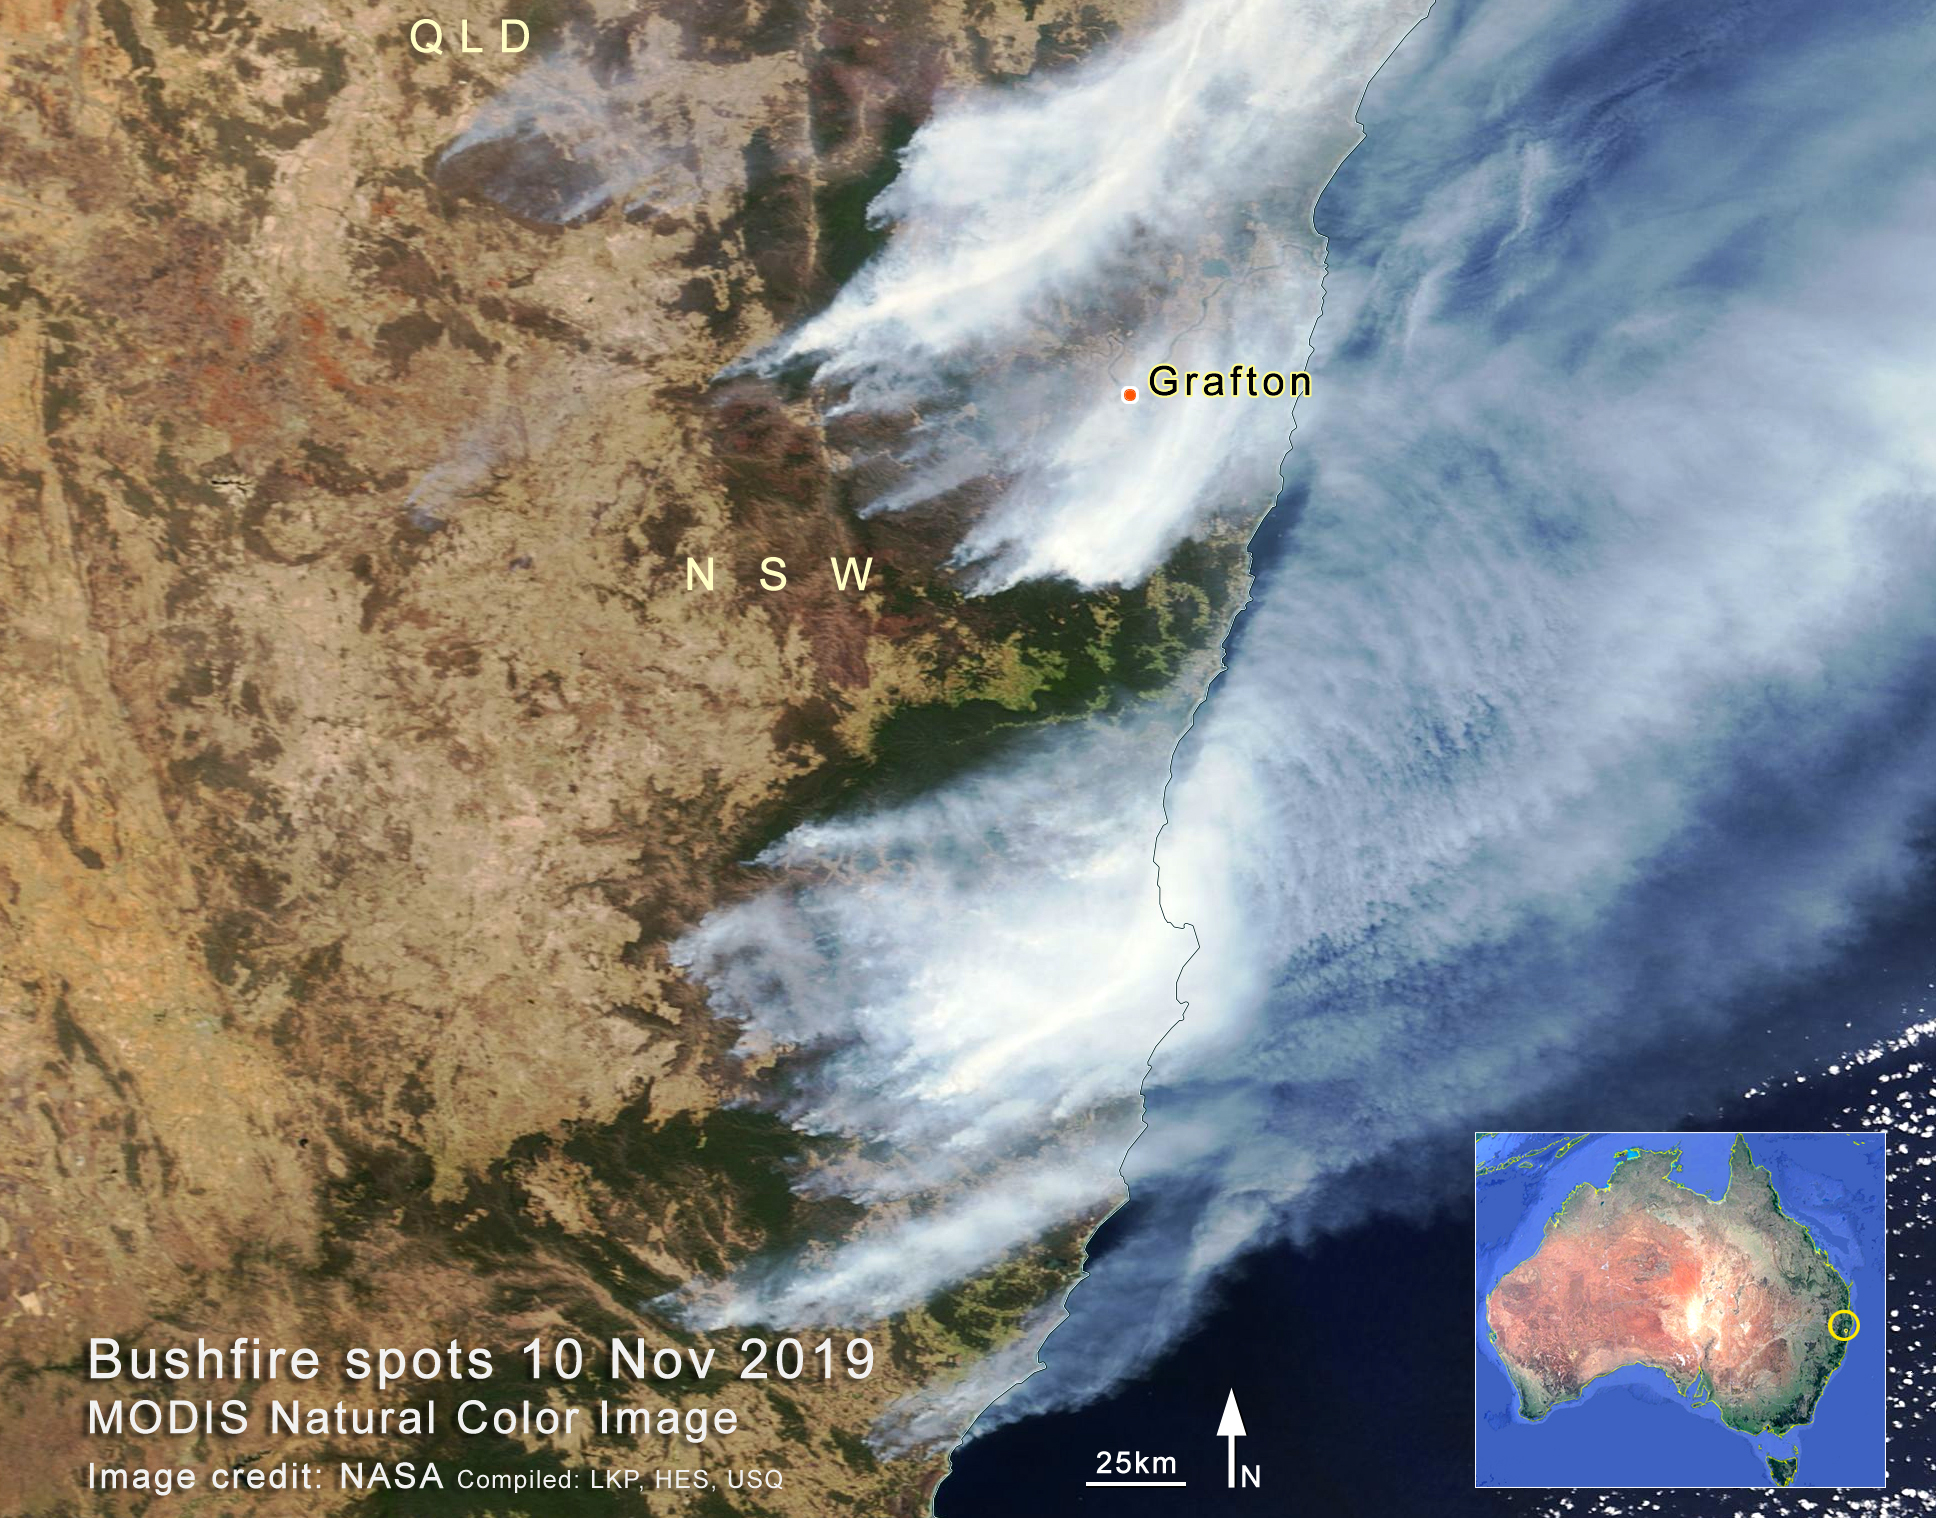
Bushfire in Australia - 2
2019/11/10
This MODIS image content shows bushfire at the devastating level in NSW, Australia.
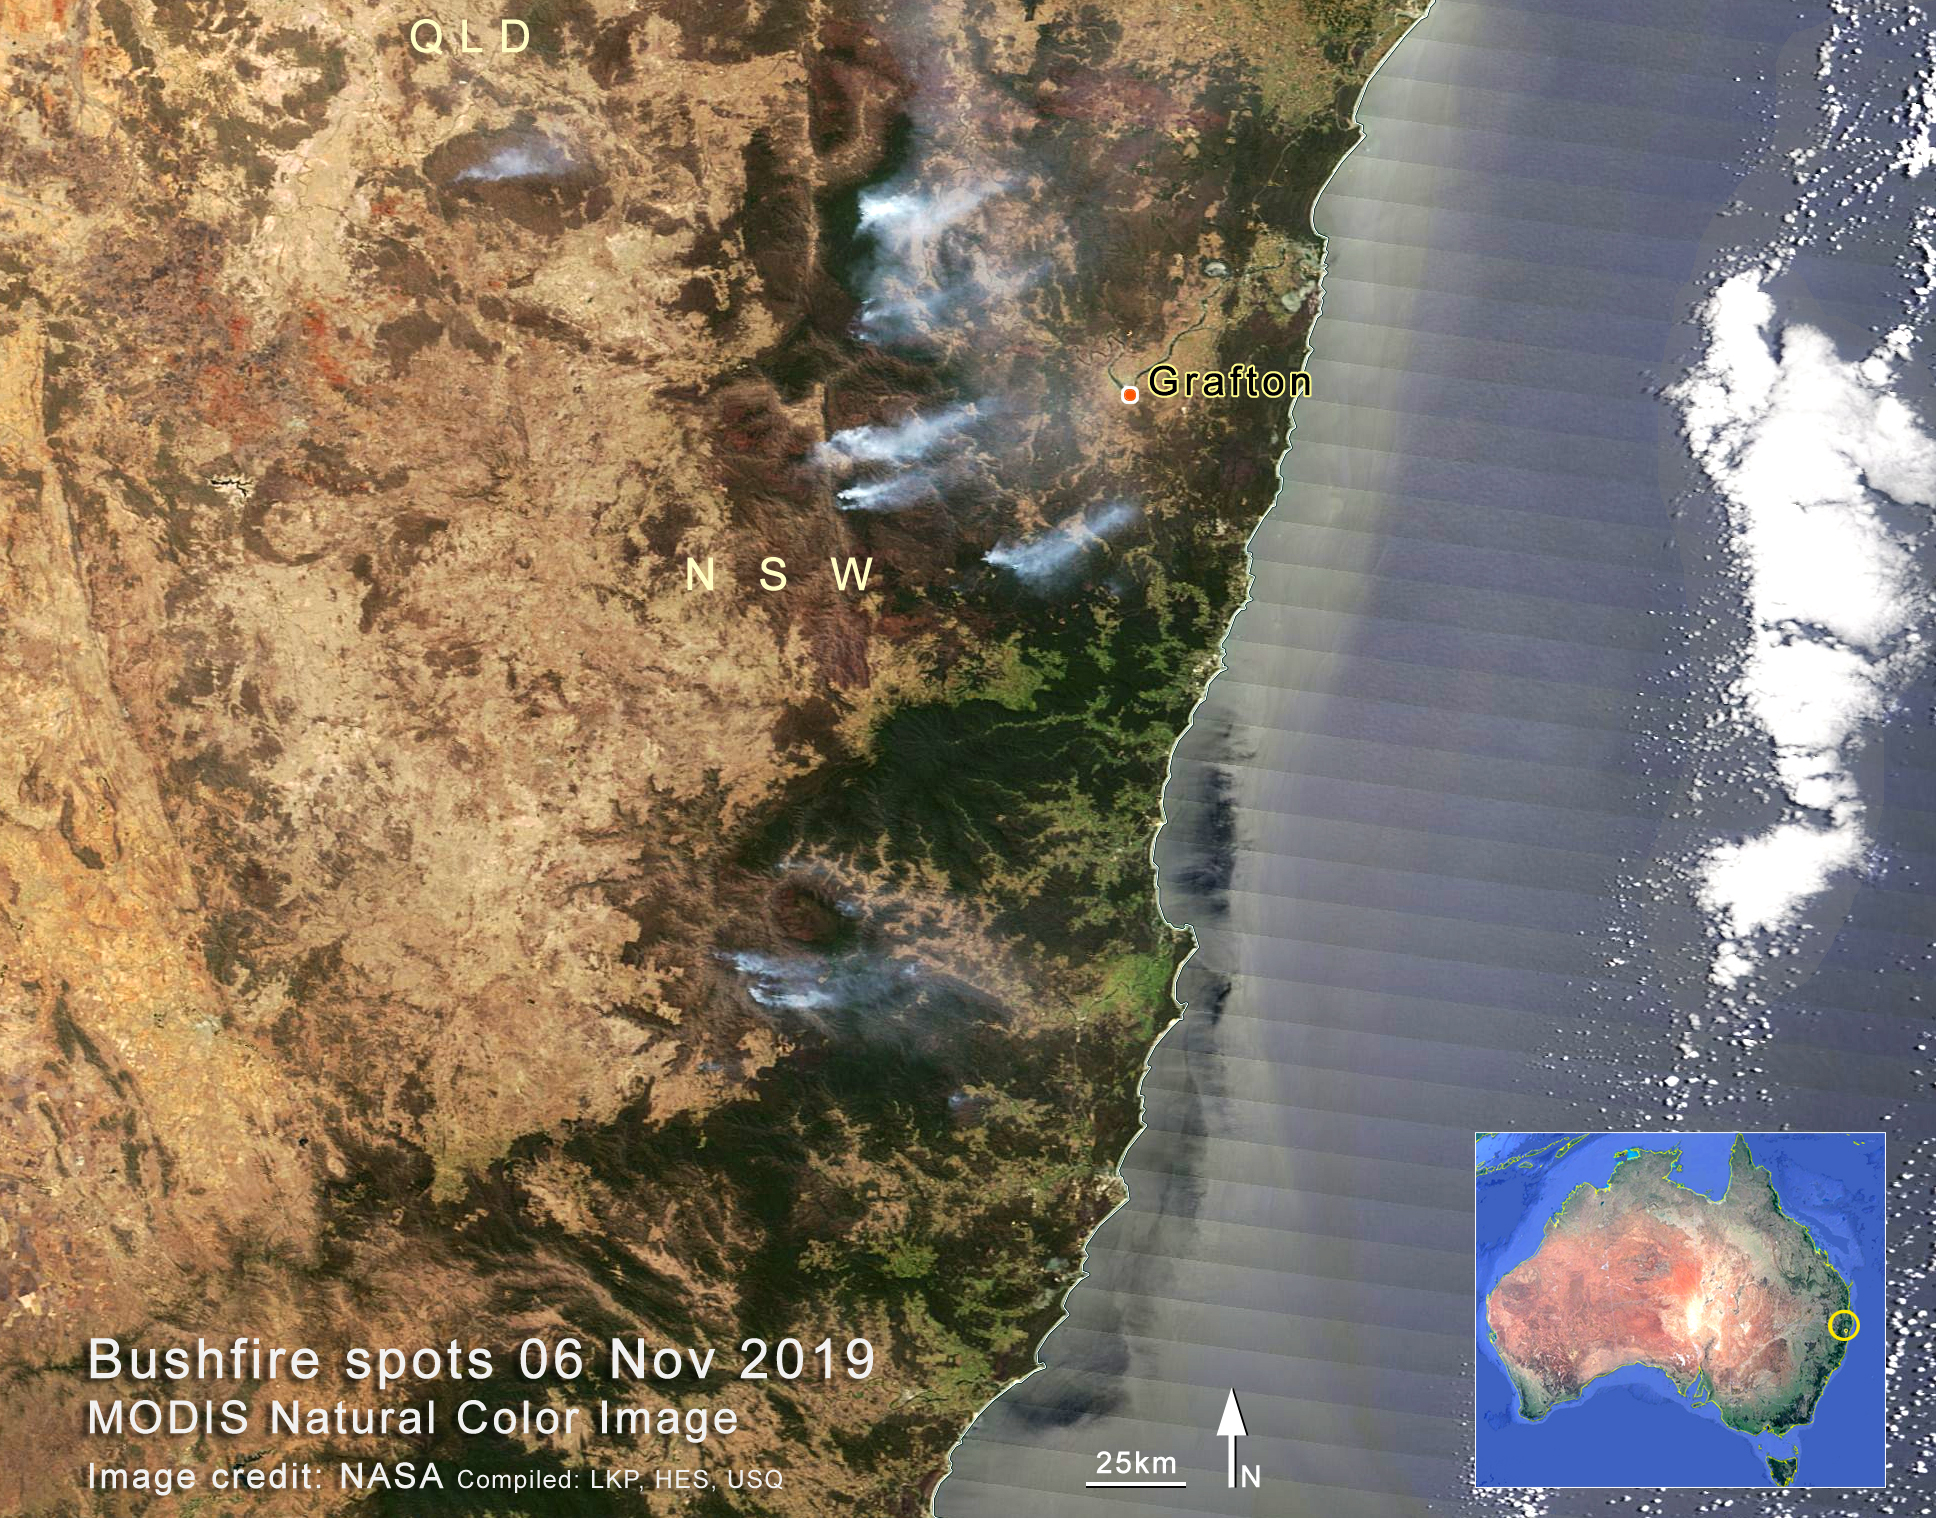
Bushfire in Australia - 1
2019/11/06
This MODIS image content shows bushfire at an early stage in NSW, Australia.
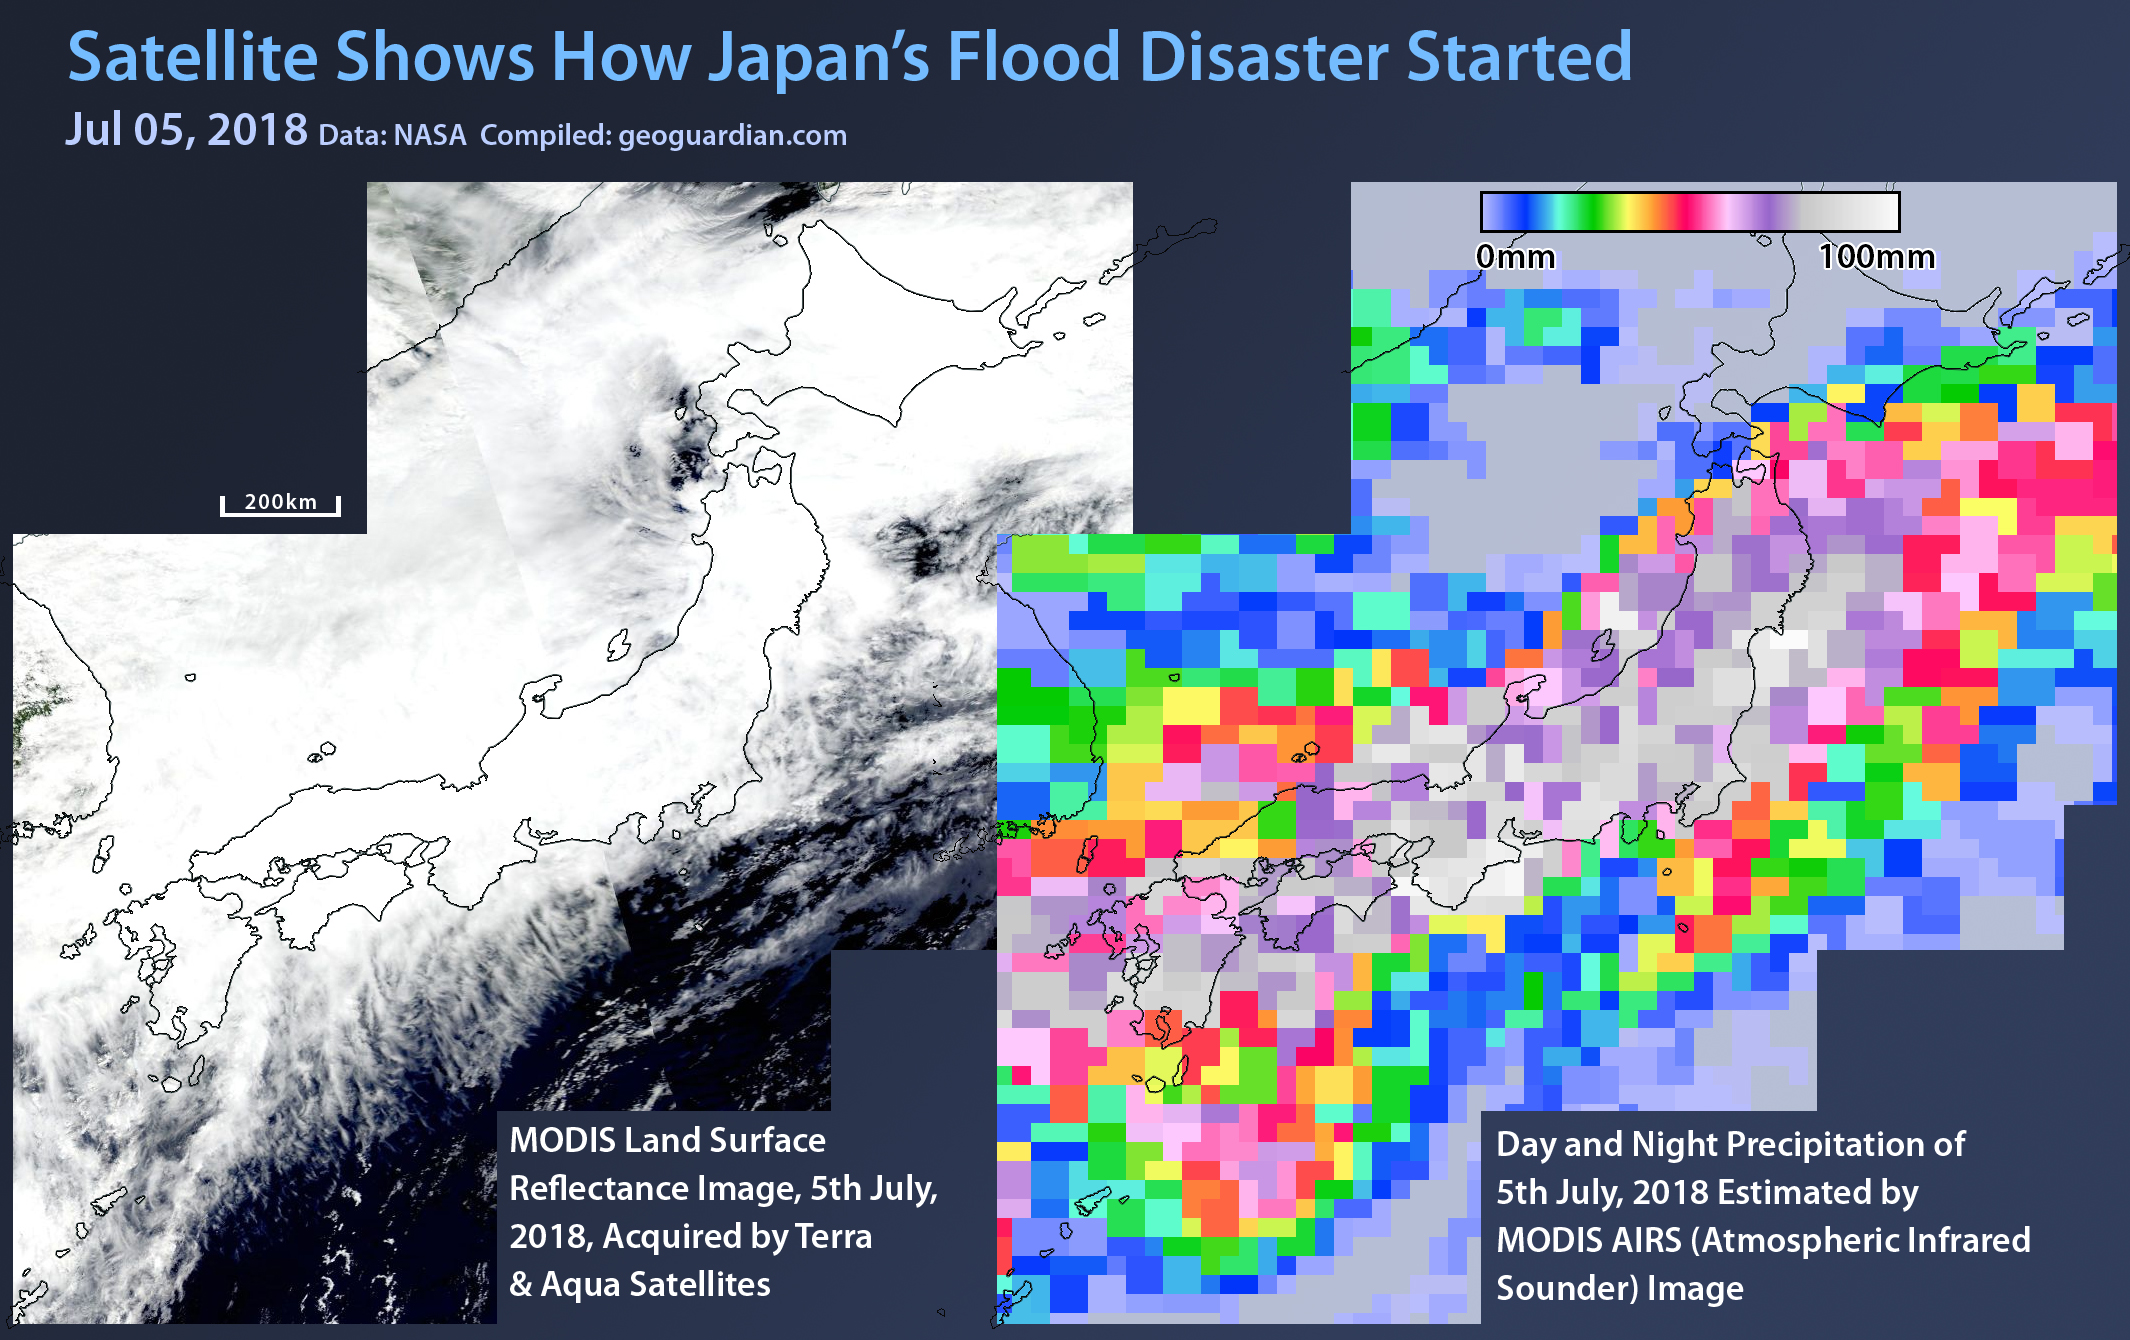
Monitoring Rain volume from MODIS satellite products
2018/07/05
The torrential rains hit Japan causing devastating floods in various regions of Japan. According to the government records, at least 155 people killed in the floods and related landslides. More than two million people were evacuated during the disaster. The images in this content shows two image products acquired from the MODIS system on 5th July, 2018. The left image shows the massive cloud formation which has fully covered Japan. The right image is from the Atmospheric Infrared Sounder, AIRS, is a facility instrument whose goal is to support climate research and improve weather forecasting. AIRS is mounted on NASA’s Aqua satellite (one of the satellites in MODIS system) launched into Earth orbit on May 4, 2002. AIRS image clearly shows the day and night precipitation volume over Japan. AIRS products have a very high potential to support weather forecasting in regions where not extensive ground observations are available.
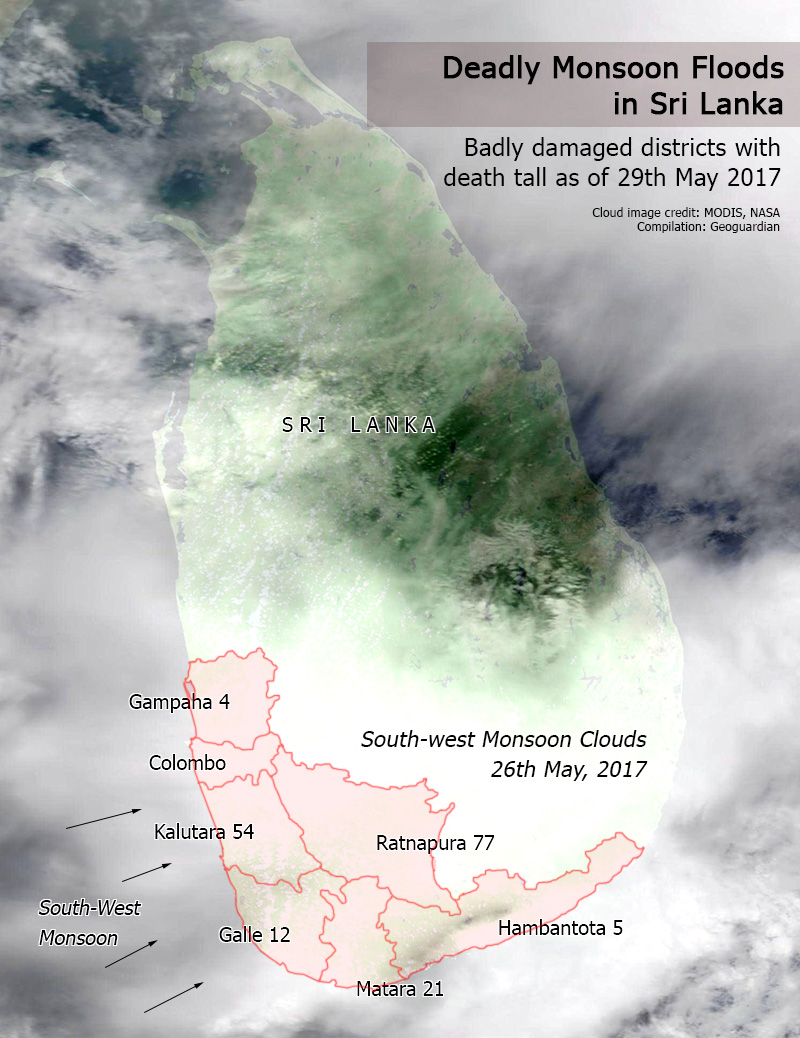
Deadly Monsoon Floods in Sri Lanka
2017/05/31
Devastating heavy monsoon rains brought widespread damage to Southwest Sri Lanka. Extremely heavy rains started since 26th May have caused landslides and floods in a number of districts killing over 180 people. Another 90 people are still missing. The image here shows heavy monsoon clouds extracted from MODIS satellite image over the island on 26th May, the day that heaviest rainfall recorded in past few days. Some lowland southwestern areas have recorded over half of the total 5 months average Southwest Monsoon rainfall, during last 7 days. Districts with heavy damage are marked in red where at least 1000 people were affected in each district. According to the government records, about 0.5 million people were affected by the disaster so far, while 1000s of houses were also damaged. Government forces and volunteers are still busy with search and rescue operations for missing people.
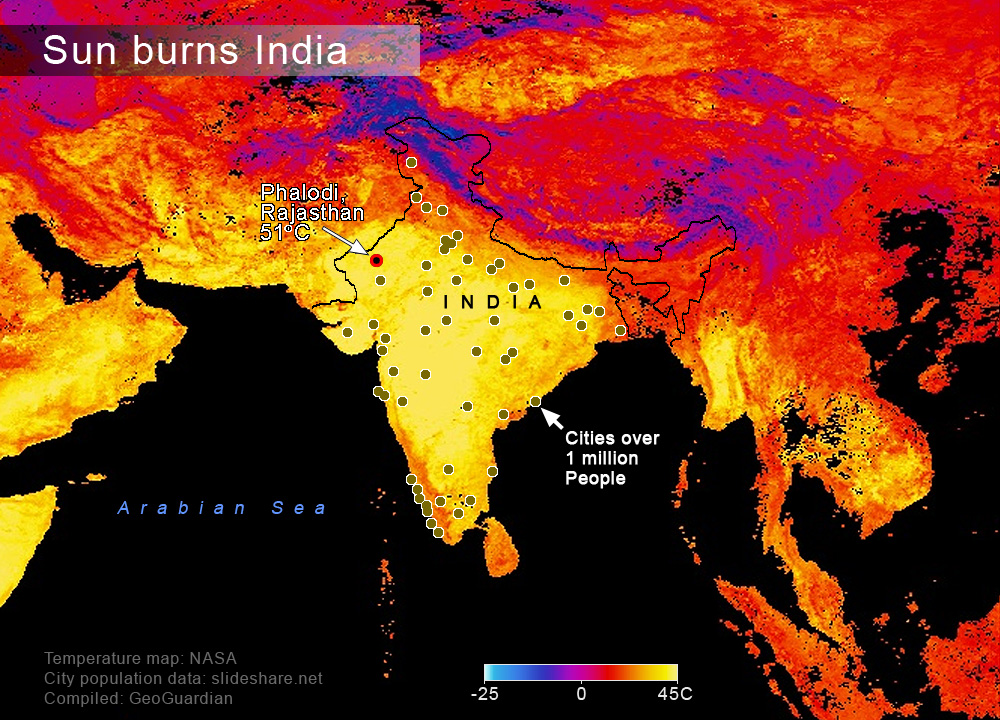
Highest recorded temperature in India
2016/05/22
The highest recorded temperature in India has reported in the town of Phalodi, in the western state of Rajasthan. The thermometer has recorded 51 degrees Celsius, breaking the previous record (50.6C) in India. Apart from Phalodi region, number of locations around Rajasthan has marked 50C. Today's image shows land surface temperature calculated by NASA which has highest value up to 45C. Also, cities over 1 million people in India have overlapped to show the massive population affected by the burning extreme weather. A large part of India (in yellow on the map) is experiencing severe heat waves and state governments estimate more than 370 people killed so far.
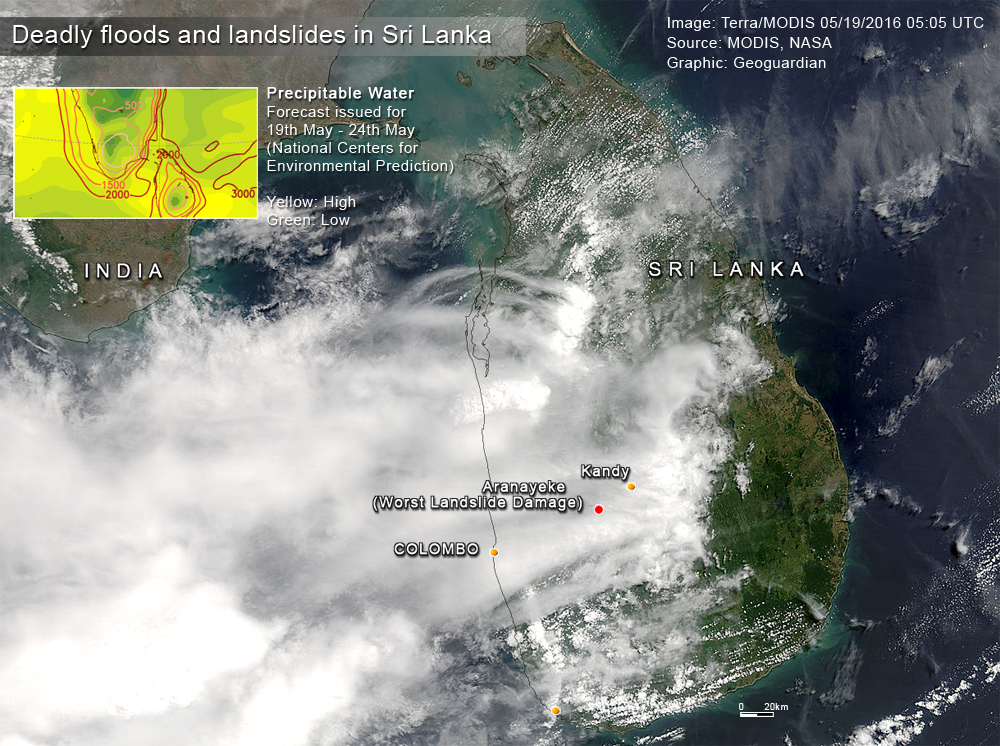
Deadly floods and landslides hit Sri Lanka
2016/05/19
Disastrous rains came with the Cyclone Roanu, have wrecked the island nation in the past few days. Local reports fear over 100 people have been killed due to the landslides in Aranayake, a hilly remote are about 60km east of the commercial capital Colombo. Since the downpour began over the weekend, about 500mm of rainfall has fallen in Mahailluppallama, a place where the mean annual rainfall is 1500mm. According to governmental figures, the death toll now stands at 58, the number of missing people is 15, and 28 have been injured. About 415,000 people have been affected by the floods and landslides. The latest cloud image here shows the continuing rainy weather over the already heavily-soaked island. Precipitable water in five-day weather forecast issued by the U.S. National Center for Environmental Prediction (NCEP) shows high potentials of rains (yellow areas in the insert map) over the affected region. Heavily damaged remote region by landslides, Aranayake, is also marked on the map.
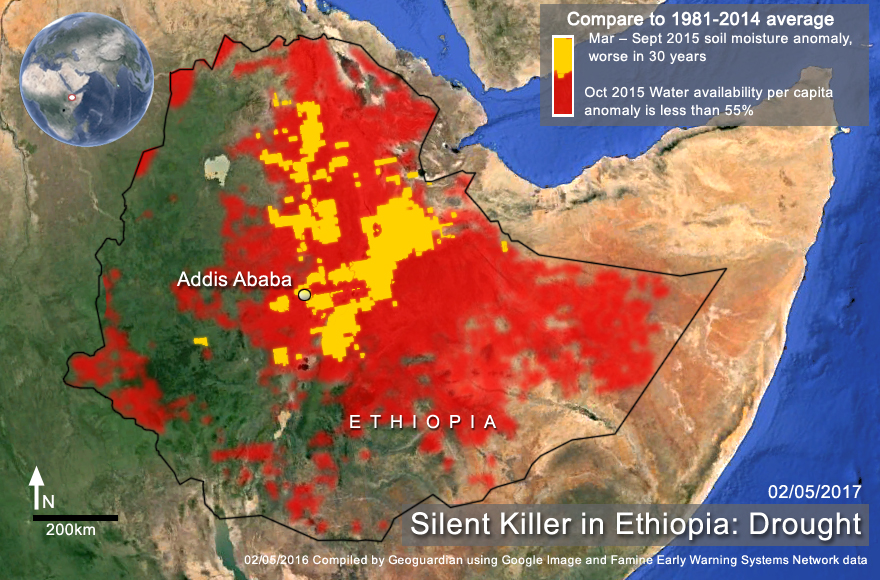
Silent killer in Ethiopia: Drought
2016/05/02
The death toll of droughts is rising without proper exposure to media, unlike most of other natural disasters. The worst drought in recent history in Ethiopia has started to take its toll. The situation is severe in neighbouring Somalia and Sudan too. The map here shows the looming drought danger in Ethiopia. Yellow shows driest areas recorded 30 years and red shows the 55% or less water availability recorded in late 2015 (compare to last 30 year average). The Government of Ethiopia estimates that 10.2 million people will require emergency food assistance in 2016, making Ethiopia the country with largest acutely food insecure population in the world. The drought has also severely hampered Ethiopia's hardly won positive economic growth in recent years. Records say millions of children and aged people are suffering from malnutrition and face the danger of famine. Already drought has destroyed a large number of livestock and 1000s of haters of farmlands. The WFP explain that the level of humanitarian need in Ethiopia has "tripled since early 2015, caused by successive harvest failures and widespread livestock deaths. Acute malnutrition has risen sharply, and one quarter of Ethiopia's districts is now officially classified as facing a nutrition crisis." In 1983-85, the worst drought recorded in last 100 years in Ethiopia has killed more than 400,000 people.
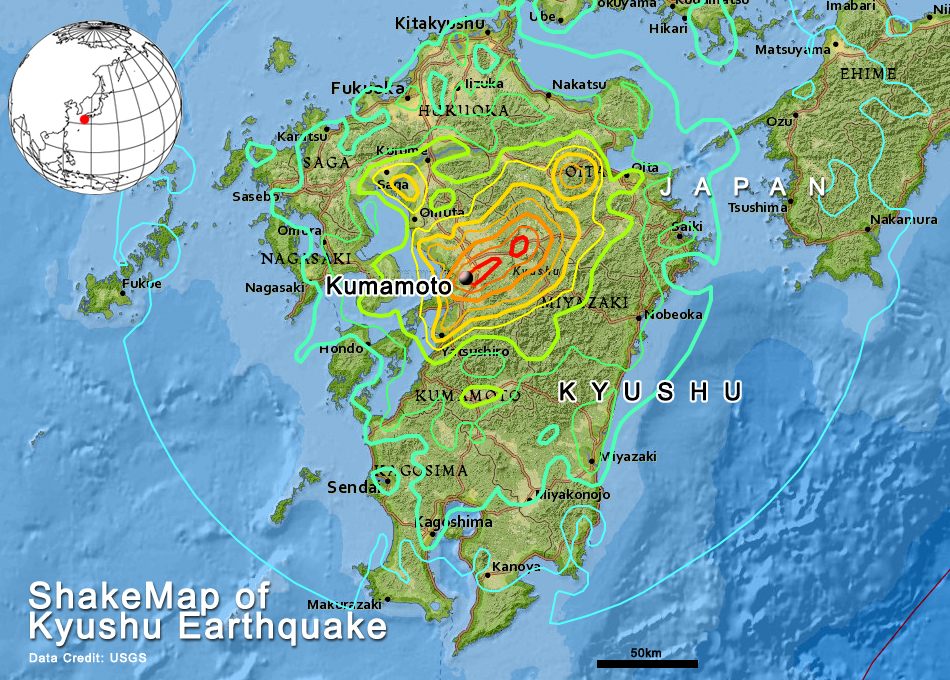
ShakeMap of Kyushu Earthquake
2016/05/20
A series of earthquakes hit Kyushu Island of Japan in 15th April, 2016, awakening the fearsome memories of the massive Tokoku earthquake hit in 2011. The magnitude 7.00 quake and a large number of aftershocks have flattened many houses in Kumamoto city and surrounding region. The death toll was relatively lower though a significant number of mostly elder people have died (about 45) from the hit. Within the same week, a magnitude 7.8 earthquake hit Ecuador, killing more than 500 people. Map shows "MMI: instrumental intensity (Modified Mercalli Intensity) units of the ShakeMap" (Red lines are most violent and teal bluelines are the least). MMI is a recent product published by USGS based on recorded ground motions. Read more at: http://usgs.github.io/shakemap/tg_intensity.html